Blob Analysis
Measures features of segmented blobs of pixels.

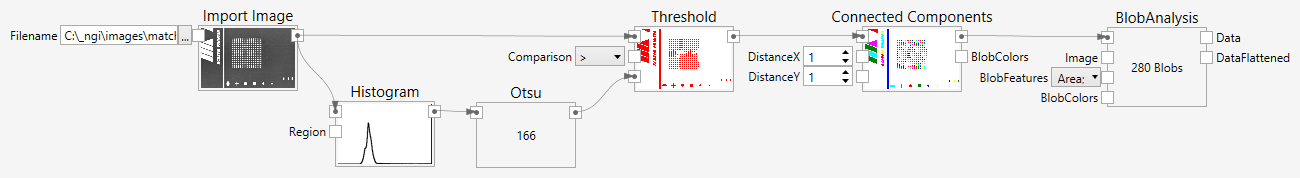
Inputs
Blobs (Type: RegionList)
The regions that define the blobs..
Image (Type: Image)
An optional image. This is only needed, if densitometric features should be calculated, because they need pixel values.
BlobFeatures (Type: List[String])
A list of strings which defines the features that should be calculated. The full set of features is described in the Blob Analysis chapter of the nVision User Guide.
BlobColors (Type: ``)
An optional list of colors that define the colors that should be used to color the different regions, so that they can be visually distinguished.
Comments
The Blob Analysis node calculates the features for a list of blobs.
The set of features can be selected with the BlobFeatures input.
The results of the blob analysis are displayed by default (if connected to the output of a sup-pipeline) as a colored overlay on top of an image in the upper half and a table in the lower half. The table shows the numeric values of the calculated features. Colored regions in the image can be clicked with the mouse to find the values in the table (the row will be highlighted). Vice versa, if the checkboxes in the Show colum are marked and geometric features (like Bounds and/or Equivalent Ellipse) are calculated, the blob is highlighted by the geometric feature (i.e. a bounding box or the equivalent ellipse).