Tools
nVision has a set of tools that are meant to make most machine vision tasks simple.
Many tasks in machine vision have similar steps, and the set of high level tools in nVision aims to make execution of these steps easy. The steps can be grouped into location, measuring, verification and identification.
The Locate menu groups the commands for part location, where location can be performed by pattern matching or shape matching.
The Measure menu groups various measurement tools, that can be used for intensity or dimensional measurement.
The Verify menu groups commands for pattern or shape verification.
The Identify menu groups the command for barcode and matrix code decoding, as well as for optical character recognition (OCR and OCV).
The tools are image oriented and display graphical elements on top of the image to select regions and other parameters.
In addition there are a few miscellaneous tools that do not fit into the above groups. They are documented below under the heading Miscellaneous.
Location
The location of a part is often a step that is executed at the beginning of a machine vision task.
Locate
The tools in this group provide location of parts based on features of these parts. These commands are often the first step in a sequence, because all subsequent tools respect the position and angle that these tools determine.
The locate tools determine a pose (a position as well as an angle) that can be used to adjust other tools regions of interest. If no location tool is used, the default pose is assumed to be in the middle of the picture.
Horizontal Shift
The Horizontal Shift tool uses horizontal edge detection to find a horizontal location. The tool is used by clicking the Horizontal Shift command button.

The tool displays a region of interest that is used to detect the shift. The region of interest can be moved by the user.
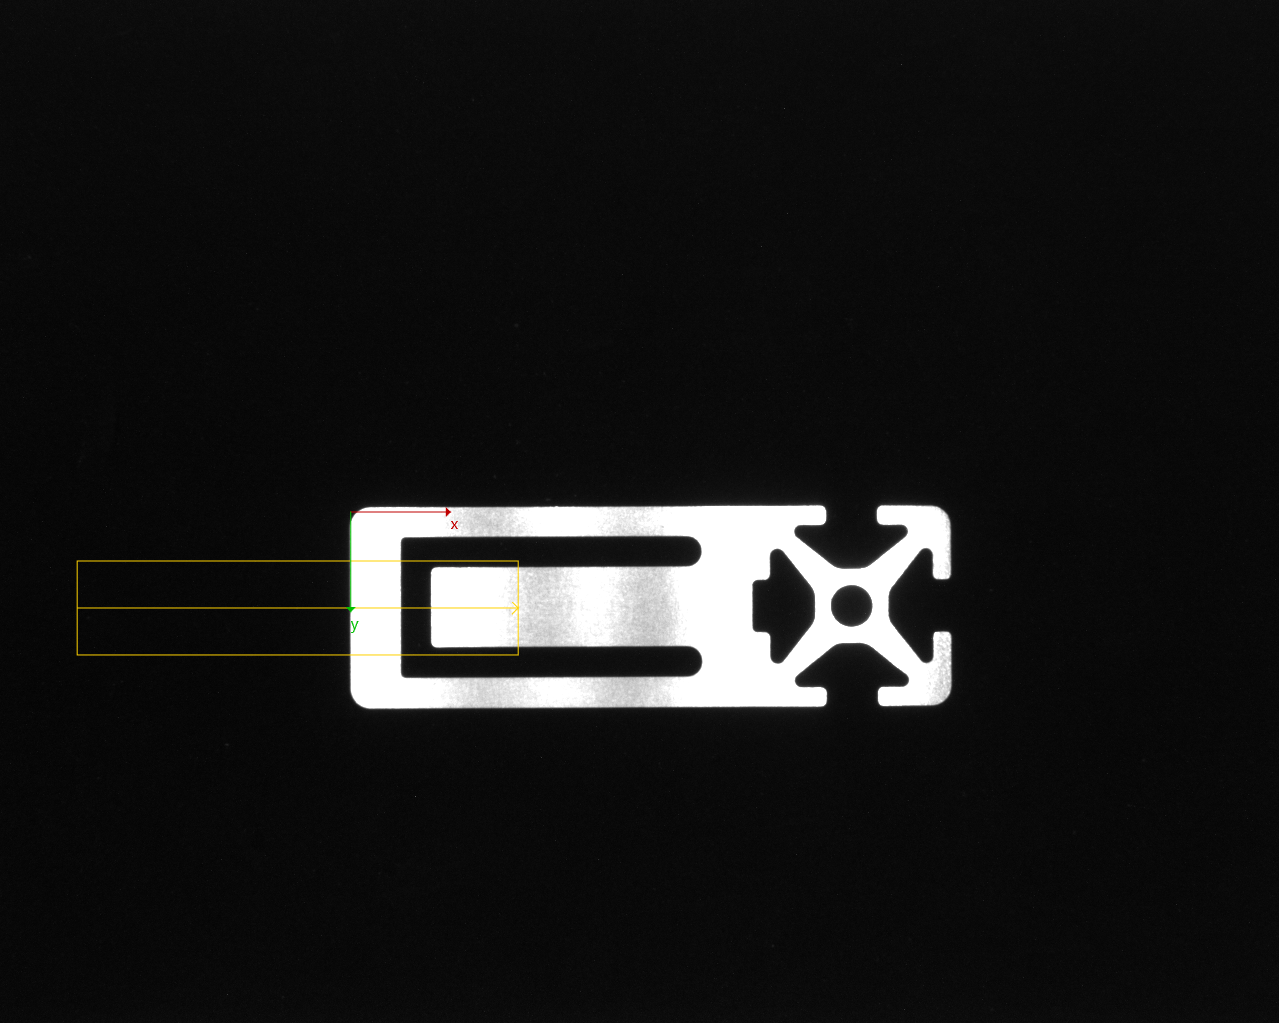
The Horizontal Shift tool has a configuration panel, which can be used to set parameters.
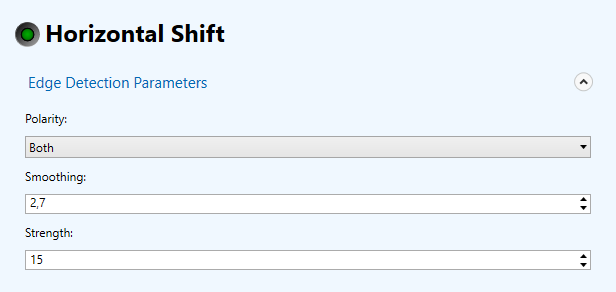
The parameters in the Edge Detection Parameters affect the edge detection.
Polarity can be used to select the type of edge: Both, Rising and Falling can be selected (default = Both). Rising means an edge going from dark to bright along the search direction, falling means an edge from bright to dark, and both means both edge types.
Smoothing is the amount of smoothing used in edge detection (default: 2.7).
Strength is the minimum strength of an edge (the gray scale slope of the edge, default = 15). Smoothing and Strength are interrelated: the more you smooth the more you lessen the strength of an edge and vice versa.
Vertical Shift
The Vertical Shift tool uses horizontal edge detection to find a horizontal location. The tool is used by clicking the Vertical Shift command button.

The tool displays a region of interest that is used to detect the shift. The region of interest can be moved by the user.
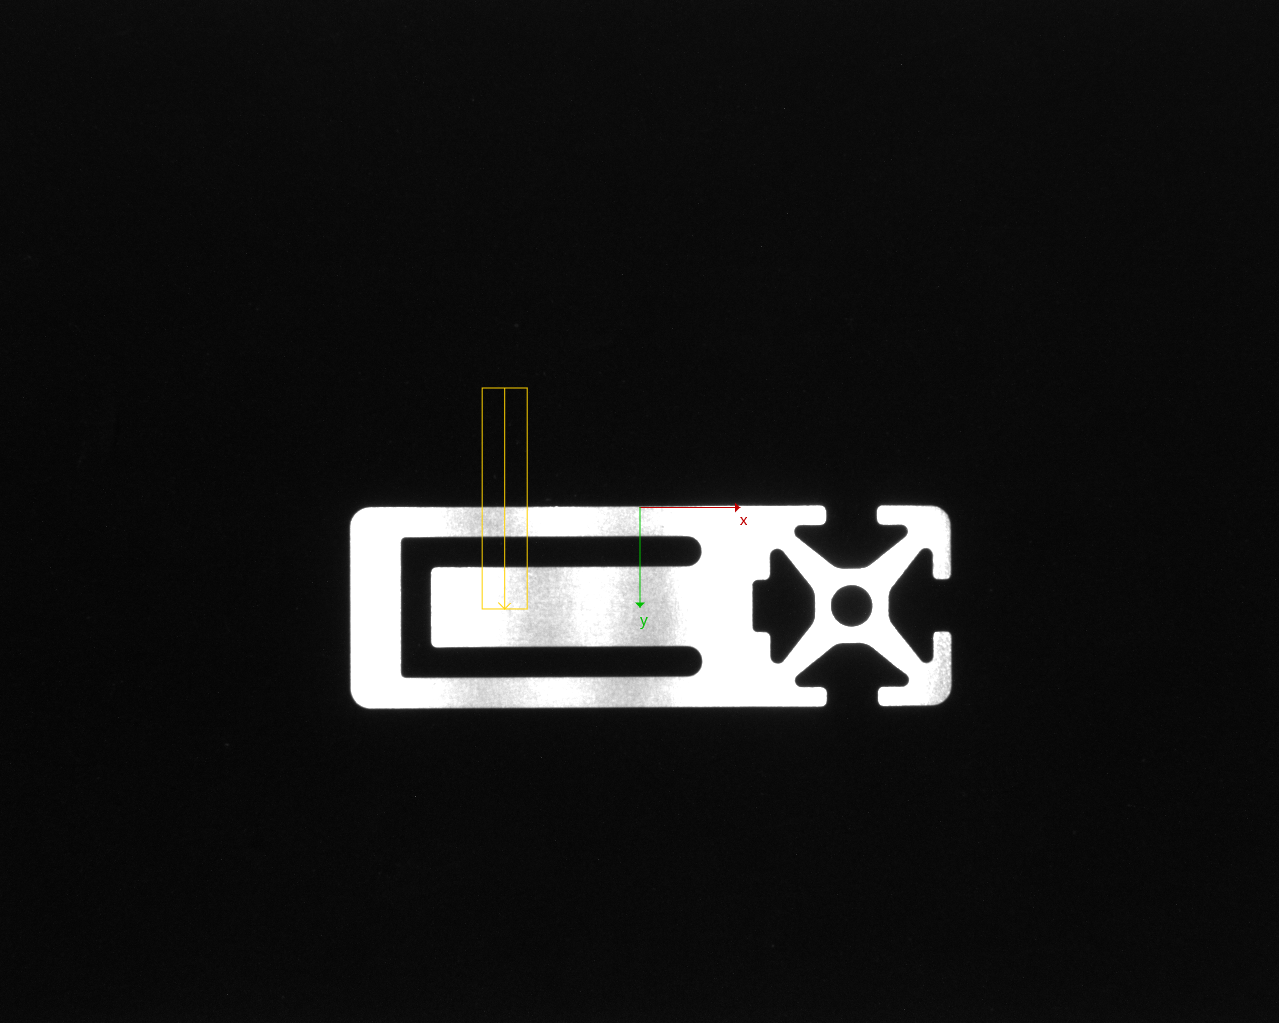
The Vertical Shift tool has a configuration panel, which can be used to set parameters.

The parameters in the Edge Detection Parameters affect the edge detection.
Polarity can be used to select the type of edge: Both, Rising and Falling can be selected (default = Both). Rising means an edge going from dark to bright along the search direction, falling means an edge from bright to dark, and both means both edge types.
Smoothing is the amount of smoothing used in edge detection (default: 2.7).
Strength is the minimum strength of an edge (the gray scale slope of the edge, default = 15). Smoothing and Strength are interrelated: the more you smooth the more you lessen the strength of an edge and vice versa.
Locate (Shape)
The locate shape tool locates a part using geometric contour matching. The tool is used by clicking the Locate (Shape) command button.

The tool displays graphical elements to specify the region of interest as well as to display the results.
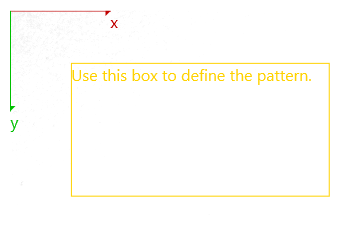
The tool displays a yellow region of interest that you can drag around to specify the pattern. You can move the box around on the image by dragging its inside. You can also resize the box by picking it at its boundary lines (on the boundary line or just a bit outside) or at its corner points (on the corner point of just a bit outside).
Make sure that you select a characteristic portion as the pattern.

Once you have moved the region of interest to a suitable position for pattern defintion, you click the Teach button to teach the pattern.
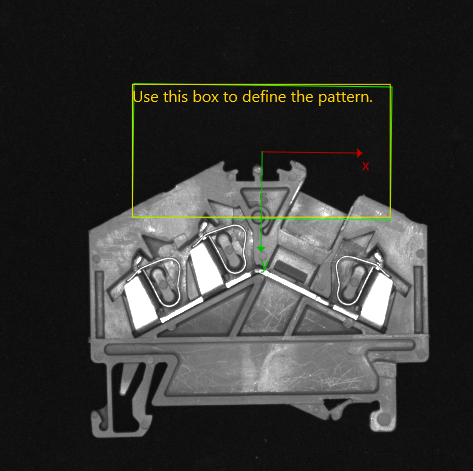
If the tool finds the pattern, it displays a green box where it found the pattern and also moves the coordinate axes to the middle of the box to visualize the new origin and rotation (the pose).
Subsequent tools use the pose to position their ROIs, such that the ROIs are always in the correct position, even if the part moves considerably.
The locate shape tool has a configuration panel, which can be used to set parameters.

The Min Score parameter is used to set the minimum score for an acceptable match (default = 0.6). Matches below this score are not considered.
Locate (Pattern)
The locate pattern tool locates a part using pattern matching. The tool is used by clicking the Locate (Pattern) command button.

The tool displays graphical elements to specify the region of interest as well as to display the results.

The tool displays a yellow region of interest that you can drag around to specify the pattern. You can move the box around on the image by dragging its inside. You can also resize the box by picking it at its boundary lines (on the boundary line or just a bit outside) or at its corner points (on the corner point of just a bit outside).
Make sure that you select a characteristic portion as the pattern.
Once you have moved the region of interest to a suitable position for pattern defintion, you click the Teach button to teach the pattern.

If the tool finds the pattern, it displays a green box where it found the pattern and also moves the coordinate axes to the middle of the box to visualize the new origin and rotation (the pose).
Subsequent tools use the pose to position their ROIs, such that the ROIs are always in the correct position, even if the part moves considerably.
The locate pattern tool has a configuration panel, which can be used to set parameters.

The Min Score parameter is used to set the minimum score for an acceptable match (default = 0.8). Matches below this score are not considered.
Measurement
Intensity
Intensity based tools measure features based on the greyvalues, such as brightness or contrast.
Brightness
The brightness tool measures the average brightness in a region of interest. The tool is used by clicking the Brightness command button.

The tool displays graphical elements to specify the region of interest as well as to display the results.
It displays a rectangle that is used to select a region. You can move the rectangle around on the image by dragging its inside. You can also resize the rectangle by picking it at its boundary lines (on the boundary line or just a bit outside). You can rotate the rectangle by picking it at its corner points (on the corner point of just a bit outside).
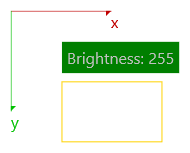
The numerical value is displayed in green, if it is in between the tool’s minimum and maximum expected values (between 127 and 255 in the following example). Because of the high reflection of the metal part, the average brightness inside the region of interest is 154, which is in between the expected bounds.

The next picture shows the tool result, if the measured angle is not within the expected boundary values (betwwen 127 and 255 in the following example). Because of the low reflection of the plastic part, the average brightness inside the region of interest is 105, which is outside the expected bounds.

The brightness tool has a configuration panel, which can be used to set parameters.

The Min Brightness parameter is used to set the minimal accepatable brightness (default = 127), the Max Brightness parameter is used to set the maximal accepatable brightness (default = 255).
Contrast
The contrast tool measures the contrast in a region of interest. The tool is used by clicking the Contrast command button. Actually, the standard deviation of the greyvalues is used as a measure of the contrast.

The tool displays graphical elements to specify the region of interest as well as to display the results.
It displays a rectangle that is used to select a region. You can move the rectangle around on the image by dragging its inside. You can also resize the rectangle by picking it at its boundary lines (on the boundary line or just a bit outside). You can rotate the rectangle by picking it at its corner points (on the corner point of just a bit outside).

The numerical value is displayed in green, if it is in between the tool’s minimum and maximum expected values (between 127 and 255 in the following example). Because of the high reflection of the metal part, the contrast inside the region of interest is 154, which is in between the expected bounds.
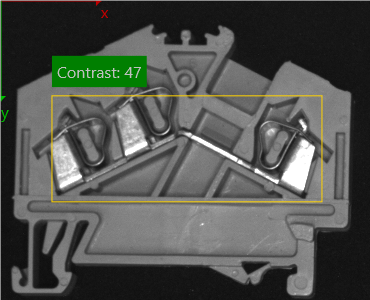
The next picture shows the tool result, if the measured angle is not within the expected boundary values (betwwen 127 and 255 in the following example). Because of the low reflection of the plastic part, the contrast inside the region of interest is 105, which is outside the expected bounds.

The contrast tool has a configuration panel, which can be used to set parameters.

The Min Contrast parameter is used to set the minimal accepatable contrast (default = 30), the Max Contrast parameter is used to set the maximal accepatable contrast (default = 255).
Geometry
The tools in this group measure geometric features.
Distance
The Distance tool measures the distance between edges along a line. The tool is used by clicking the Distance command button.

The tool displays graphical elements to specify the region of interest as well as to display the results.
It displays a yellow line that specifies the search line. You can move the line around on the image by dragging it. You can also pick either of the line endpoints to move just this endpoint.
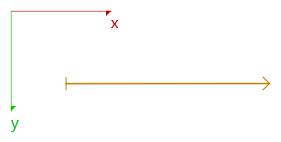
Once the search line has been positioned over two edges in the image it displays the calculated distance, which is visualized graphically and its numerical value is displayed in green, if it is in between the tool’s minimum and maximum expected values (between 129 px and 130 px in the following example):

The next picture shows the tool result, if the measured distance is not within the expected boundary values (betwwen 49 px and 51 px):

This makes it easy to see the tool’s outcome.
The distance tool has a configuration panel, which can be used to set parameters.
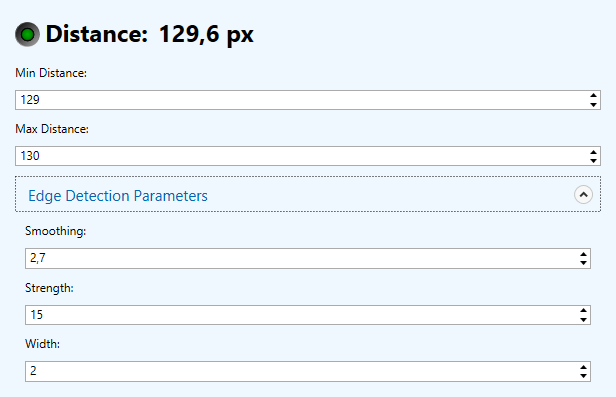
The Min and Max parameters are used to set the expected minimum and maximum distance.
The parameters in the Edge Detection Parameters affect the edge detection.
Smoothing is the amount of smoothing used in edge detection (default: 2.7). Strength is the minimum strength of an edge (the gray scale slope of the edge, default = 15). Smoothing and Strength are interrelated: the more you smooth the more you lessen the strength of an edge and vice versa.
Width is the width of the stripe along the line region.
Distance (Two Points)
The Distance (Two Points) measures the distance between two points. The tool is used by clicking the Distance (Two Points) button.

The tool displays graphical elements to specify the region of interest as well as to display the results.
It displays two yellow lines labelled A and B that specify the search linees. You can move the lines around on the image by dragging them. You can also pick either of the line endpoints to prolong the line or move just this endpoint (move the mouse a little bit away from the endpoint, until the cursor changes).

Once the search lines have been positioned over two edges in the image the calculated distance, which is visualized graphically and its numerical value are displayed.
The Distance (Two Points) tool has a configuration panel, which can be used to set parameters.

The Min and Max parameters are used to set the expected minimum and maximum distance.
The distance type between the two points can be the straight, horizontal or vertical distances.
The parameters in the Edge Detection Parameters affect the edge detection.
Smoothing is the amount of smoothing used in edge detection (default: 2.7). Strength is the minimum strength of an edge (the gray scale slope of the edge, default = 15). Smoothing and Strength are interrelated: the more you smooth the more you lessen the strength of an edge and vice versa.
Width is the width of the stripe along the line region.
Circle
The circle tool measures a circle in a region of interest. The tool is used by clicking the Circle command button.

The tool displays graphical elements to specify the region of interest as well as to display the results.
It displays a yellow box that specifies the region of interest. You can move the box around on the image by dragging its inside. You can also resize the box by picking its boundary lines (on the boundary line or just a bit outside) or its corner points (on the corner point of just a bit outside). Inside the box is a little yellow point that markes the center of the box.
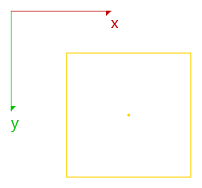
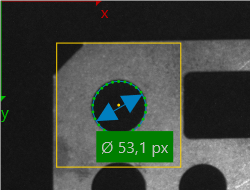
Once the box has been positioned over a circle (or part of a circle) in the image it displays the calculated circle, which is visualized graphically and its numerical diameter is displayed in green, if it is in between the tool’s minimum and maximum expected values (between 53 px and 54 px in the following example):
The next picture shows the tool result, if the measured distance is not within the expected boundary values (betwwen 50 px and 51 px):
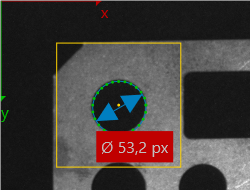
This makes it easy to see the tool’s outcome.
The circle tool has a configuration panel, which can be used to set parameters.

The Min and Max parameters are used to set the expected minimum and maximum diameter.
The parameters in the Edge Detection Parameters affect the edge detection.
Smoothing is the amount of smoothing used in edge detection (default: 2.7). Strength is the minimum strength of an edge (the gray scale slope of the edge, default = 15). Smoothing and Strength are interrelated: the more you smooth the more you lessen the strength of an edge and vice versa.
Polarity can be used to select the type of edge: Both, Rising and Falling can be selected (default = Both). Rising means an edge going from dark to bright along the search direction, falling means an edge from bright to dark, and both means both edge types.
Spacing is the angular spacing in degrees of the search lines.
Angle
The angle tool measures the angle between two lines. The tool is used by clicking the Angle command button.

The tool displays graphical elements to specify the region of interest as well as to display the results.
It displays two boxes that are used to select regions, the boxes are labeled A and B. You can move the boxes around on the image by dragging their inside. You can also resize the boxes by picking them at their boundary lines (on the boundary line or just a bit outside) or at their corner points (on the corner point of just a bit outside). The arrows at the boxes visualize the search direction of the line detection (box A has horizontal arrows and should be used for vertical lines, box B has vertical arrows and should be used for horizontal lines).
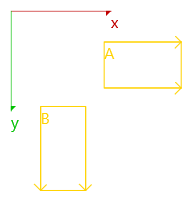
Once the search box has been positioned over an edge in the image it displays the calculated edge points in green, and a resulting line in blue that it calculates by fitting a line through the points.

The tool has outlier detection as you can see in the following picture. The outlier points are marked in red and they are not used for the line fit.

The search boxes move with the pose, that is their position is relative to the part position that has been determined by a location tool upstream.
If the tool finds both lines it calculates the angle between those lines. The angle is visualized graphically and its numerical value is displayed in green, if it is in between the tool’s minimum and maximum expected values (between 89,7 ° and 90,3 ° in the following example):

The next picture shows the tool result, if the measured angle is not within the expected boundary values (betwwen 89,9 ° and 90,1 °):

This makes it easy to see the tool’s outcome.
The angle tool has a configuration panel, which can be used to set parameters.

The Min and Max parameters are used to set the expected minimum and maximum angles.
The parameters in the Edge Detection Parameters affect the edge detection.
Smoothing is the amount of smoothing used in edge detection (default: 2.7). Strength is the minimum strength of an edge (the gray scale slope of the edge, default = 15). Smoothing and Strength are interrelated: the more you smooth the more you lessen the strength of an edge and vice versa.
Polarity can be used to select the type of edge: Both, Rising and Falling can be selected (default = Both). Rising means an edge going from dark to bright along the search direction, falling means an edge from bright to dark, and both means both edge types.
Spacing is the distance between the search lines of the edge detection (default = 5). The effect of the spacing can be seen by the density of the visualized edge points.
Area Size
The area size tool measures the object area in a region of interest. The tool is used by clicking the Area Size command button.

The tool displays graphical elements to specify the region of interest as well as to display the results.
It displays a rectangle that is used to select a region. You can move the rectangle around on the image by dragging its inside. You can also resize the rectangle by picking it at its boundary lines (on the boundary line or just a bit outside). You can rotate the rectangle by picking it at its corner points (on the corner point of just a bit outside).
The tool is meant to be used on regions where you have contrasting objects, either dark or bright. It automatically detects the objects. In a region without much contrast, using the tool is mostly meaningless because of noise.
The numerical value is displayed in green, if it is in between the tool’s minimum and maximum expected values.
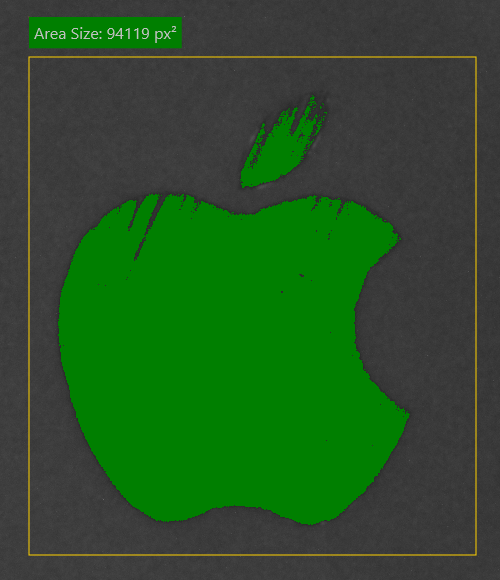
The next picture shows the tool result, if the measured area is not within the expected boundary values.
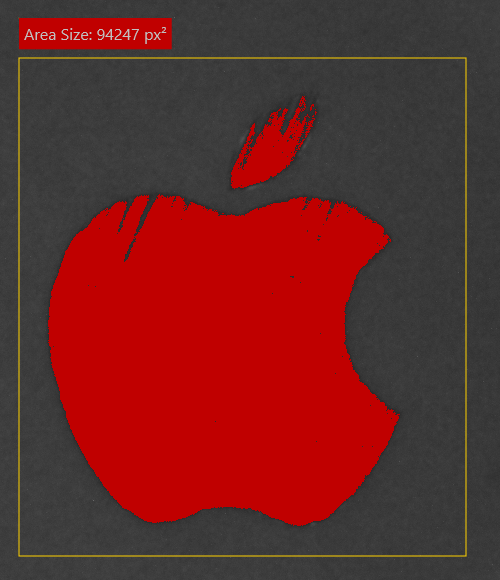
The area size tool has a configuration panel, which can be used to set parameters.

The Min parameter is used to set the minimal accepatable area, the Max parameter is used to set the maximal accepatable area.
The Polarity can be set to Dark Objects or Bright Objects.
Count
The tools in this group count various things, and compare the number to the expected number or range.
Count Edges
The count tool counts the number of edges along a linear region of interest. The tool is used by clicking the Count Edges command button.

The tool displays graphical elements to specify the region of interest as well as to display the results.
It displays a yellow line that specifies the search line. You can move the line around on the image by dragging it. You can also pick either of the line endpoints to move just this endpoint.
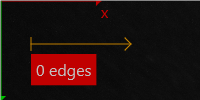
Once the line has been positioned and finds edges, it visualizes them as blue points and it outputs their number. If the number is within expected bounds, the tool color is green.

The next picture shows the tool result, if the number of edges is not within the expected boundary values:

This makes it easy to see the tool’s outcome.
The tool has a configuration panel, which can be used to set parameters.

The Min and Max parameters are used to set the expected minimum and maximum diameter.
The parameters in the Edge Detection Parameters affect the edge detection.
Smoothing is the amount of smoothing used in edge detection (default: 2.7). Strength is the minimum strength of an edge (the gray scale slope of the edge, default = 15). Smoothing and Strength are interrelated: the more you smooth the more you lessen the strength of an edge and vice versa.
Count Contour Points
The count contour points tool counts the number of high-contrasting pixels within a region of interest. The tool is used by clicking the Count Contour Points command button.

The tool displays graphical elements to specify the region of interest as well as to display the results.
It displays a rectangle that is used to select a region. You can move the rectangle around on the image by dragging its inside. You can also resize the rectangle by picking it at its boundary lines (on the boundary line or just a bit outside). You can rotate the rectangle by picking it at its corner points (on the corner point of just a bit outside).
One use of the tool is to check for riffle or embossing on metal parts.
The numerical value is displayed in green, if it is in between the tool’s minimum and maximum expected values.

The next picture shows the tool result, if the number of contour points is not within the expected boundary values.

The count contour points tool has a configuration panel, which can be used to set parameters.

The Min parameter is used to set the minimal accepatable area, the Max parameter is used to set the maximal accepatable area.
The Sensitivity can be set to a value between 0 (highly sensitive) and 255 (not sensitive).
Count Areas
The count areas tool counts the number of objects in a region of interest. The tool is used by clicking the Count Areas command button.

The tool displays graphical elements to specify the region of interest as well as to display the results.
It displays a rectangle that is used to select a region. You can move the rectangle around on the image by dragging its inside. You can also resize the rectangle by picking it at its boundary lines (on the boundary line or just a bit outside). You can rotate the rectangle by picking it at its corner points (on the corner point of just a bit outside).
The tool is meant to be used on regions where you have contrasting objects, either dark or bright. It automatically detects the objects. In a region without much contrast, using the tool is mostly meaningless because of noise.
The numerical value is displayed in green, if it is in between the tool’s minimum and maximum expected values.

The next picture shows the tool result, if the measured area is not within the expected boundary values.

The count areas tool has a configuration panel, which can be used to set parameters.

The Min parameter is used to set the minimal accepatable area, the Max parameter is used to set the maximal accepatable area.
The Polarity can be set to Dark Objects or Bright Objects.
Verification
Features
The tools in this group provide matching of parts based on features of these parts.
Match Contour
The match contour tool locates a part using geometric pattern matching. The tool is used by clicking the Match Contour command button.

The tool displays graphical elements to specify the region of interest as well as to display the results.
The tool displays a yellow region of interest that you can drag around to specify the pattern. You can move the box around on the image by dragging its inside. You can also resize the box by picking it at its boundary lines (on the boundary line or just a bit outside) or at its corner points (on the corner point of just a bit outside).
Usually, the box is put tightly around an area where you expect a specific pattern, which is loaded from a file somewhere.
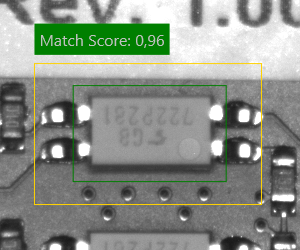
If the tool finds the pattern, it displays a green box where it found the pattern and displays the match score (between 0 and 1, where 1 is a perfect match). Scores below 0.3 are mostly meaningless. Please not that the characteristic of the score is different to the one used in the Match Pattern command.
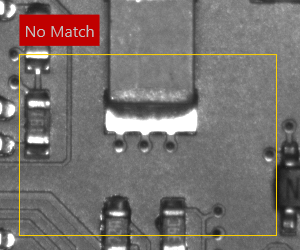
If the tools cannot find the pattern at all, or if the score is too low, it displays a red box if possible and outputs the text “No Match” in red.
The match pattern tool has a configuration panel, which can be used to set parameters.

The Template parameter specifies the match template, which is loaded from disk.
The Min Score parameter is used to set the minimum score for an acceptable match (default = 0.7). Matches below this score are not considered.
Match Pattern
The match pattern tool locates a part using normalized correlation matching. The tool is used by clicking the Match Pattern command button.

The tool displays graphical elements to specify the region of interest as well as to display the results.
The tool displays a yellow region of interest that you can drag around to specify the pattern. You can move the box around on the image by dragging its inside. You can also resize the box by picking it at its boundary lines (on the boundary line or just a bit outside) or at its corner points (on the corner point of just a bit outside).
Usually, the box is put tightly around an area where you expect a specific pattern, which is loaded from a file somewhere.
If the tool finds the pattern, it displays a green box where it found the pattern and displays the match score (between 0 and 1, where 1 is a perfect match). Scores below 0.5 are mostly meaningless. Please not that the characteristic of the score is different to the one used in the Match Contour command.
If the tools cannot find the pattern at all, or if the score is too low, it displays a red box if possible and outputs the text “No Match” in red.
The match pattern tool has a configuration panel, which can be used to set parameters.
The Template parameter specifies the match template, which is loaded from disk.
The Min Score parameter is used to set the minimum score for an acceptable match (default = 0.7). Matches below this score are not considered.
Identification
Codes
The tools in this group perform barcode and matrix code decoding. Various symbologies are supported. In addition, the tools can match the decoded text to an expected pattern.
Barcode
The barcode tool decodes a barcode inside a region of interest. The tool is used by clicking the Barcode command button.

The tool displays graphical elements to specify the region of interest as well as to display the results.
It displays a box that is used to select the region of interest. You can move the box around on the image by dragging its inside. You can also resize the box by picking its boundary lines (on the boundary line or just a bit outside) or its corner points (on the corner point of just a bit outside).

Once the search box has been positioned over a code in the image it tries to decode the code. Its position and the decoded text is displayed in green, if it matches the expected text (anything in this case):

The next picture shows the tool result, if the decoded text does not match the expectation:
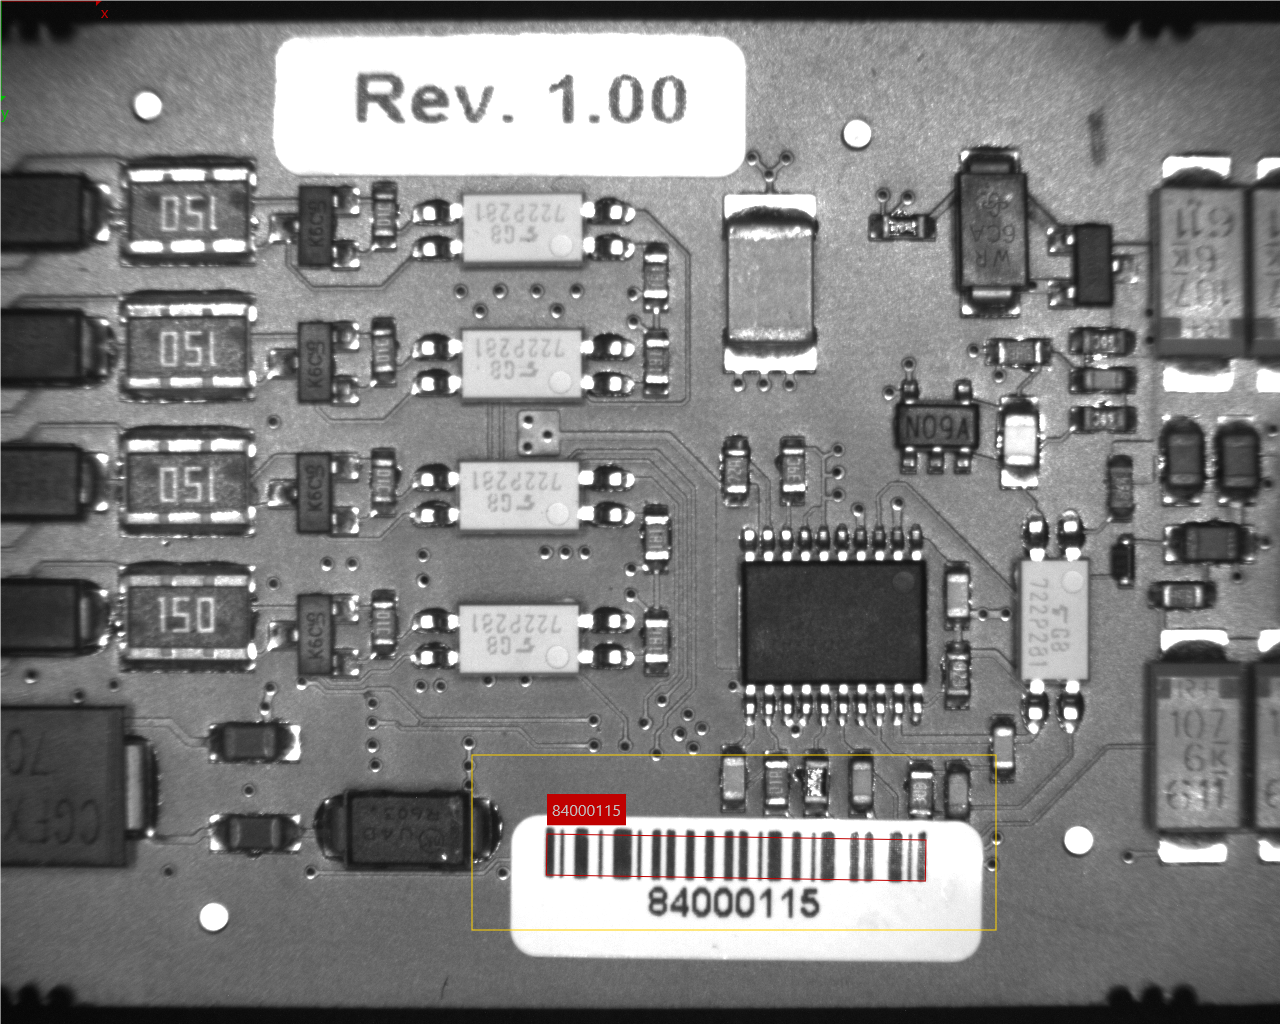
This makes it easy to see the tool’s outcome.
The barcode tool has a configuration panel, which can be used to set parameters.

The controls in Pattern Matching allow you to specify a pattern that the decoded result must follow in order to be correct.
Regular Expression: Defines the pattern that the decoded string should match. The pattern follows the rule of a regular expression, specifically the .NET variant of regular expressions.
The following table explains common cases. For full information, look at the original documentation (https://msdn.microsoft.com/en-us/library/az24scfc(v=vs.110).aspx).
| Pattern | Description | ||
|---|---|---|---|
. |
Any character (except newline). | a.c |
abc, aac, acc, … |
^ |
Start of a string. | ^abc |
abc, abcdefg, abc123, … |
$ |
End of a string. | abc$ |
abc, endsinabc, 123abc, … |
| |
Alternation. | bill|ted |
bill, ted |
[...] |
Explicit set of characters to match. | a[bB]c |
abc, aBc |
* |
0 or more of previous expression. | ab*c |
ac, abc, abbc, … |
+ |
1 or more of previous expression. | ab+c |
abc, abbc, abbbc, … |
? |
0 or 1 of previous expression; also forces minimal matching when an expression might match several strings within a search string. | ab?c |
ac, abc |
{…} |
Explicit quantifier notation. | ab{2}c |
abbc |
(…) |
Logical grouping of part of an expression. | (abc){2} |
abcabc |
\\ |
Preceding one of the above, it makes it a literal instead of a special character. | a\\.b |
a.b |
Ignore Case: If checked the case of the characters is ignored, otherwise the case must match exactly.
The controls in Enabled Symbologies allow you to enable or disable specific symbologies. Supported symbologies are Code 39, Code 30 Extended, Code 93, EAN 128, EAN 8, EAN 13, UPC A, UPC E, Databar and Databar Limited.
The controls in Decoder Parameters allow you to manipulate locator and decoder behavior.
Number of Scanning Directions: 0: vertical, 1: horizontal, 2: both, 3 and more: oblique, every 180/N degrees. The default setting of 4 means the locator scans every 45 degrees.
Scanning Density: The spacing between scanning-lines, in pixels; small values favor the decoding rate and increase the running time. 5 is the default.
Noise: The noise threshold. Threshold level to get rid of spurious bars caused by noise. 40 is the default.
Check Quiet Zone: Check the quiet zone. When checked, a quiet zone as large as the standard requires must be present; when set to false, it is advisable to disable other symbologies to avoid false matches. The default is checked.
Minimum Bars: The minimum number of bars for a successfull decode.
Matrixcode
The matrixcode tool decodes a two-dimensional barcode inside a region of interest. The tool is used by clicking the Matrixcode command button.

The tool displays graphical elements to specify the region of interest as well as to display the results.
It displays a box that is used to select the region of interest. You can move the box around on the image by dragging its inside. You can also resize the box by picking its boundary lines (on the boundary line or just a bit outside) or its corner points (on the corner point of just a bit outside).

Once the search box has been positioned over a code in the image it tries to decode the code. Its position and the decoded text is displayed in green, if it matches the expected text (anything in this case):
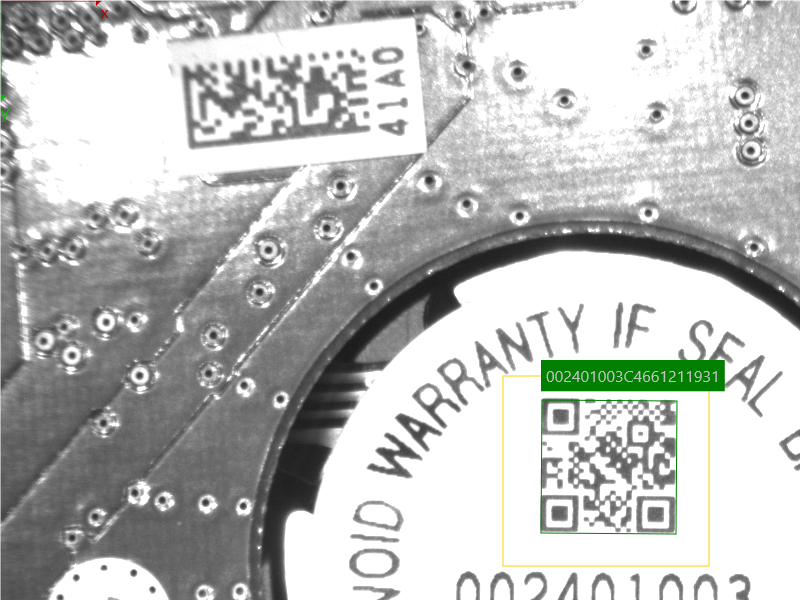
The next picture shows the tool result, if the decoded text does not match the expectation:

This makes it easy to see the tool’s outcome.
The matrixcode tool has a configuration panel, which can be used to set parameters.

The controls in Pattern Matching allow you to specify a pattern that the decoded result must follow in order to be correct.
Regular Expression: Defines the pattern that the decoded string should match. The pattern follows the rule of a regular expression, specifically the .NET variant of regular expressions.
The following table explains common cases. For full information, look at the original documentation (https://msdn.microsoft.com/en-us/library/az24scfc(v=vs.110).aspx).
| Pattern | Description | ||
|---|---|---|---|
. |
Any character (except newline). | a.c |
abc, aac, acc, … |
^ |
Start of a string. | ^abc |
abc, abcdefg, abc123, … |
$ |
End of a string. | abc$ |
abc, endsinabc, 123abc, … |
| |
Alternation. | bill|ted |
bill, ted |
[...] |
Explicit set of characters to match. | a[bB]c |
abc, aBc |
* |
0 or more of previous expression. | ab*c |
ac, abc, abbc, … |
+ |
1 or more of previous expression. | ab+c |
abc, abbc, abbbc, … |
? |
0 or 1 of previous expression; also forces minimal matching when an expression might match several strings within a search string. | ab?c |
ac, abc |
{…} |
Explicit quantifier notation. | ab{2}c |
abbc |
(…) |
Logical grouping of part of an expression. | (abc){2} |
abcabc |
\\ |
Preceding one of the above, it makes it a literal instead of a special character. | a\\.b |
a.b |
Ignore Case: If checked the case of the characters is ignored, otherwise the case must match exactly.
The controls in Enabled Symbologies allow you to enable or disable specific symbologies. Supported symbologies are Data Matrix and QR Code.
The controls in Decoder Parameters allow you to manipulate locator and decoder behavior.
Polarities: Selects the possible contrast of the marking. Auto (default), Black on White or White on Black.
Views: Selects the possible orientation of the marking. Auto (default), Straight or Mirrored.
Miscellaneous
Adjust Camera
The Adjust Camera tab on the Home menu contains the Exposure tool and various calibration tools, which can be used to set the exposure time of a camera and establish a world to image coordinate calibration.
Exposure
The Exposure tool is used to set the exposure time of a camera. It works with GenICam cameras that have the exposure time parameter. The tool is used by clicking the Exposure command button (Home - Acquire).

The tool displays the live image and shows over-exposed parts in yellow and underexposed parts in blue.
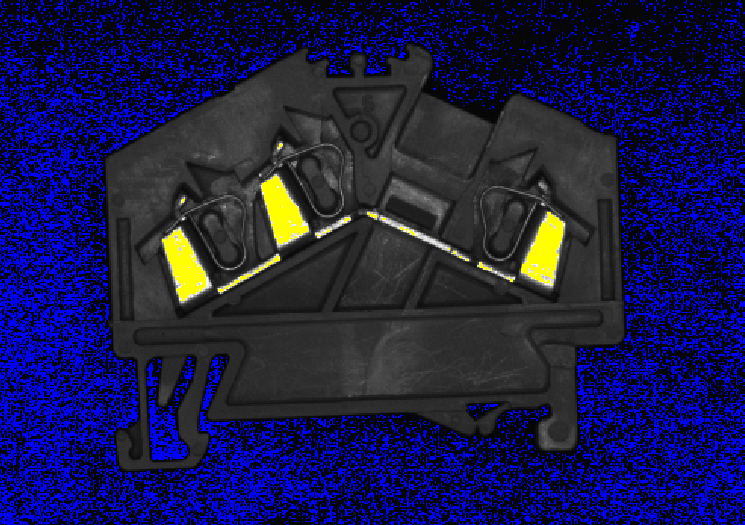
The exposure tool has a configuration panel, which can be used to set parameters.

The Exposure Time is the exposure time in ms (milliseconds). It uses GenICam to write the exposure time to the camera, which has to be connected to the global Camera output port in the system globals.
Underflow and Overflow show the respective percentages of the underflow and overflow pixels.
At the bottom, a graphic of the brightness histogram is shown.
When the exposure time is changed, the blue and yellow image overlays, the percentage values and the histogram graphic are all affected and change. The graphic and numeric outputs help you to properly set exposure time interactively.
Define Scale
The Define Scale tool is used to define an overall scale in the image. You can use it if your optical axis is orthogonal to the measurement plane, and if the desired measurement accuracy is not to high.

The tool calculates a calibration factor that is used to convert pixel measurements to world units, such as µm, mm, cm or m (or any other spatial unit that is needed in your application). Once a calibration has been established, other length measurement tools respect the calibration and output their measurments in world unit (as opposed to image units in pixels).
The Define Scale tool can use a line to establish a scale.
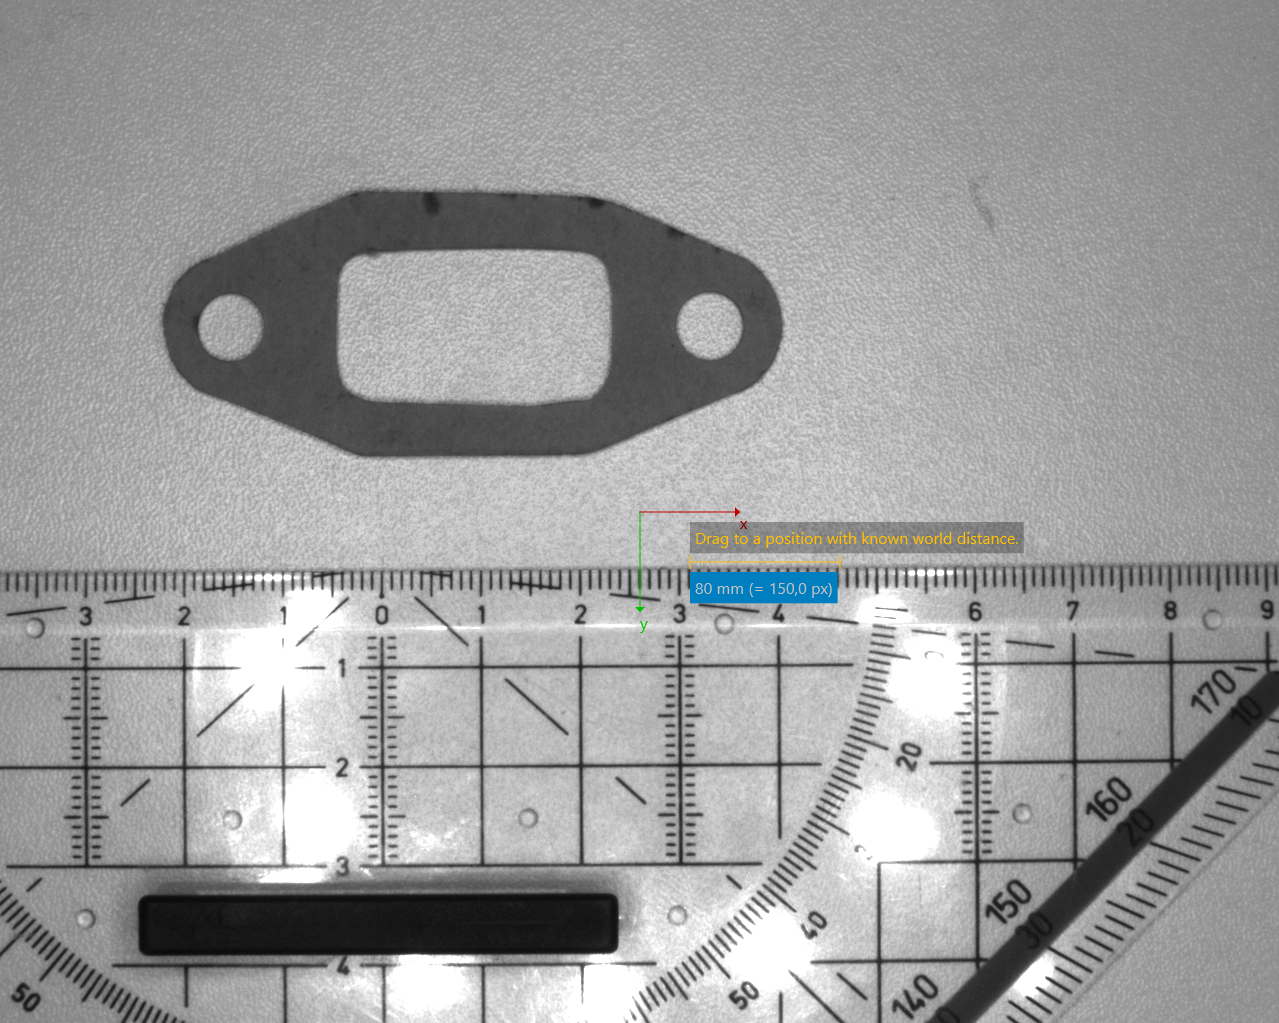
Alternatively, it can use a circle to establish a scale.

The Define Scale tool has a configuration panel where you can select whether you want to use a line or a circle for setting the scale.

Once you have aligned the line or circle with a know distance in your image, type the distance as well as the unit and press the Teach button.
Calibrate
The Calibrate tool is used to establish a camera calibration. The calibration can correct a perspective distortion and still measure proper distances in the calibrated plane.

The tool detects the positions of dots on a calibration target and uses those to detect the perspective distortion. In addition to the detected dot positions the tool needs to know the distance between two dots in world units as well as the world unit.

Only the dots within the region of interest turn blue and are used for calibration.
The Calibrate tool has a configuration panel where you can enter the distance between two dots as well as the world units.
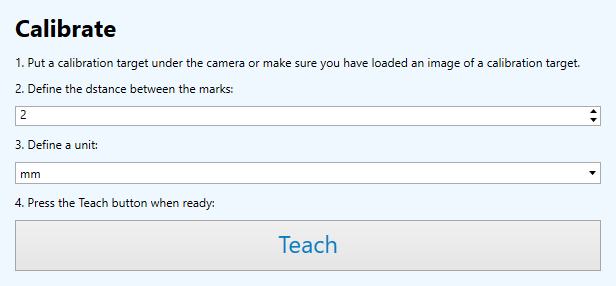
Once you have a proper image of the calibration target and entered the distance between the dots as well as the unit, press the Teach button.
Pipeline
The Result tab on the Pipeline menu contains the result tool, which provides a simple means of communication.
Result
The result tool is used to communicate the result of an inspection task. It works with an Adam module from Advantec. The tool is used by clicking the Result command button (Pipeline - Result).

The result tool writes the result in the form of an electrical signal to the Adam module.
The result tool has a configuration panel, which can be used to set parameters.

The parameters in Configure IO specify the electrical lines that are switched on.
OK specifies the number of the output of the Adam module which is used to signal the OK state.
Not OK specifies the number of the output of the Adam moduel which is used to signal the not OK state.