Color
The term color space describes the representation of colors with numbers. An infinite number of color spaces is in existence and a large number is in everyday use today.
Physically, color is a sensation that can be described with a spectrum, a mixture of light waves of different wavelengths between 380 nm and 700 nm. The spectrum is a physical quantity that can be measured by appropriate means.
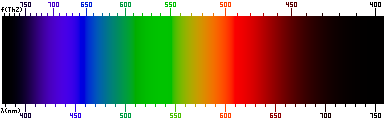
The Visible Spectrum
However, color is also a human sensation that is formed in the human brain by means of stimulation via the eye. This makes it a bit difficult to talk about color, since some people might perceive it slightly different. In fact, there are people which exhibit certain forms of color blindness such that their perception is different from people with normal color vision.
Since there seems to be slightly different color perception even among non-color-blind people, the CIE has defined a normal observer with a defined color perception.

The CIE Standard Observer Color Matching Functions
The normal observer has been defined in 1931 by testing around 200 people with normal vision. These people have been asked to mix a color that they observed on a 2 degree view centered in the middle of the retina with three colored light sources (red, green and blue). The numbers of the mixtures have been recorded and served to derive the normal spectrum. In 1964 a similar experiment has been carried out to determine the 10 degree normal spectrum.
Color primaries (red, green and blue) are mixed to approximate the color spectrum in most television and computer displays.

The Color Display Spectrum
Use of Color Spaces in Image Reproduction and Television
Image reproduction in print or television faces very difficult problems, since images are often viewed in dramatically different conditions than they were taken. For example take a scene in the open field on a bright sunny day which has been filmed and is viewed by the audience in a dark cinema at total darkness. Yet, the color impression should be natural for the audience. Similar problems exist in print, where paper, ink and process differences make it very difficult to achieve satisfying results.
While the color space conversion functions in nVision can be used to compensate for these effects, nVision has not been designed specifically to provide the equivalent of a color management system.
Use of Color Spaces in Image Analysis
In image analysis color spaces are often used to provide a means for qualitative separation of colors. Depending on the specific needs, some color spaces are more suitable than others, and therefore the need of color space transformation arises.
The color space transformations available in nVision have been designed to target the needs in image analysis.
The CIE Color Spaces
With the standard observer color matching functions, the CIE defined the XYZ color space. The tristimulus values for a color with a spectral power distribution I(λ) are given in terms of the standard observer by:
Since the human eye has three types of color sensors, a full plot of all visible colors is a three-dimensional figure. However, if brightness is stripped off, chromaticity remains. For example brown is a darker version of yellow, they have the same chromaticity but different brightness.
The XYZ color space was designed so that the Y parameter was a measure of the brightness of a color. The chromaticity of a color could then be specified by the parameters x and y:
Because of the normalization, the third parameter z is not needed:
The derived color space specified by x, y and Y is known as the CIE xyY color space and is widely used to specify colors in practice.

The CIE Color Space Chromaticity Diagram
The RGB Color Space
There is not only one RGB color space. Instead, more information must be presented to precisely define the specific variant of RGB. Notably, the XYZ coordinates of the red, green and blue Primaries must be known, as well as the white point.
A very good source of information is the website of Bruce Lindbloom, notably the page titled “RGB Working Space Information”.
Most images nowadays use the sRGB color space, and this is also the default chosen by the nVision software.
The HLS and HSI Color Spaces
These color models are based on an artist’s concepts of tint, shade and tone. The coordinate system is cylindrical and the models are designed to provide intuitive color specification.
The HLS (hue, lightness, saturation) color model forms a double cone in a cylindrical space. Hue is the angle around the vertical axis, with red at 0 degrees, green at 120 degrees and blue at 240 degrees. The colors accur around the perimeter in the same order as in the CIE chromaticity diagram. Lightness is along the vertical center axis and ranges from black at the bottom over the various grey shades to white at the top. Saturation is the radial distance from the center axis and specifies how much color and grey are mixed.
The HSI (hue, saturation, intensity) color model forms a cone, where the top plane contains white in the center and saturated colors around the perimeter. The bottom tip of the cone is black. As with the HLS model, hue is the angle around the vertical axis, with red at 0 degrees, green at 120 degrees and blue at 240 degrees.
The mathematics of the both models are described in “Foley, van Dam: Computer Graphics: Principles and Practice”.
Both color spaces make it easy to segment images based on colors.
The L*a*b* Color Space
The L*a*b* color space (sometimes also called CIELAB) is a color opponent space. It is physically non-linear to provide perceptual uniformity. The difference betwwen colors can then be calculated simply by computing their Euclidean distance. While HLS/HSI provide are intuitive, but not uniform, L*a*b adds uniformity.
The mathematics of the L*a*b* color space is described in “Reinhard: Color Imaging”.
Color Space Conversion
nVision has functions to convert images between different color spaces.